Analysis of the Most Discussed Television Programs on Twitter and their Relationship with the Traditional Audience in Spain
Análisis de los programas de televisión más comentados en Twitter y su relación con la audiencia tradicional en España
Análise dos programas de televisão mais comentados no Twitter e sua relação com a audiência tradicional na Espanha
Jorge Gallardo-Camacho1, Eva Lavín2, Paula Fernández-García3
1 Universidad Camilo José Cela. España.
jgallardo@ucjc.edu
2 Universidad Camilo José Cela. España.
elavin@ucjc.edu
3 Univesity of Oviedo. España.
paula@uniovi.es
Recibido: 2015-10-15 / Enviado a pares: 2015-10-15 / Aprobado por pares: 2015-11-23 / Aceptado: 2015-12-09
DOI: 10.5294/pacla.2016.19.1.8
Para citar este artículo / to reference this article / para citar este artigo
Gallardo-Camacho, J., Lavín, E. & Fernández-García, P. (Marzo de 2016). Analysis of the most discussed television programs on Twitter and their relationship with the traditional audience in Spain. Palabra Clave, 19(1), 185-210. DOI: 10.5294/pacla.2016.19.1.8
|
Abstract In this paper we analyze the most discussed television programs broadcast in Spain based on the number of users in Twitter (not comments). There were two objectives: to know which television programs are the most tweeted based on their genre and their time slots, and to observe if the most watched television programs are also the most tweeted. We use a quantitative methodology based on Spearman's correlation and the Kappa coefficient from the data obtained during 30 days (150 observations). The data allows us to conclude that the most tweeted programs are tabloid talk shows and TV news magazines, reality shows and sporting events, and that 63.3% of the most tweeted programs are broadcast between 8:30 p.m. and 12 a.m. We have also noticed that if a television program is ranked in first place as the most watched that day or in its time slot, it has more probabilities than others to be in the top-five commented programs on Twitter. We also believe that the results found in Spain can be generalized to other countries and audiovisual markets. Keywords Television programs, televiewers, broadcasting, social networks, audience participation (Source: Unesco Thesaurus). |
Resumen En este artículo analizaremos los programas de televisión más comentados y emitidos en España basándonos en el número de usuarios de Twitter (y no en el número de comentarios). Planteamos dos objetivos: saber qué programas de televisión son los más tuiteados según su género y su franja horaria; y observar si los programas de televisión más vistos son también los más tuiteados. Para ello, utilizaremos una metodología cuantitativa basada en la correlación de Spearman y el coeficiente de Kappa a partir de los datos obtenidos durante 30 días (150 observaciones). Los datos nos permiten concluir que los programas más tuiteados son los talk shows y los magacines informativos, los reality shows y los eventos deportivos; y que el 63,3 % de los programas más tuiteados son emitidos entre las 8:30 p.m. y las 12 a.m. También hemos detectado que si un programa de televisión está clasificado en el primer lugar como el más visto ese día o en su franja, tiene más probabilidades que el resto de estar entre los cinco más comentados en Twitter. Creemos que los resultados hallados en España pueden aplicarse a otros países y mercados audiovisuales. Palabras clave Programas de televisión, telespectadores, emisiones de televisión, redes sociales, participación de audiencias (Fuente: Tesauro de la Unesco). |
Resumo Neste artigo, analisaremos os programas de televisão mais comentados e emitidos na Espanha baseando-nos no número de usuários do Twitter (e não no número de comentários). Propomos dois objetivos: saber quais programas de televisão são mais tuitados segundo seu gênero e faixa horária, e observar se os programas de televisão mais assistidos são também os mais tuitados. Para isso, utilizaremos uma metodologia quantitativa, baseada na correlação Spearman e no coeficiente de Kappa a partir dos dados obtidos durante 30 dias (150 observações). Os dados nos permitem concluir que os programas mais tuitados são os talk shows, os jornais informativos, os reality shows e os eventos esportivos; além disso, 63,3% dos programas mais tuitados são emitidos entre 20h30 e 0h. Também identificamos que se um programa de televisão está classificado em primeiro lugar como o mais visto nesse dia ou em sua faixa tem mais probabilidades do que os demais de estar entre os cinco mais comentados no Twitter. Acreditamos que os resultados constatados na Espanha podem ser aplicados a outros países e mercados audiovisuais. Palavras-chave Programas de televisão, telespectadores, emissões de televisão, redes sociais, participação de audiências (Fonte: Tesauro da Unesco). |
Introduction: Twitter and television
The relationship between television and social networks such as Twitter is getting stronger and stronger every day. Watching television has always been considered a simple and unidirectional activity, but viewers are now using a second screen more and more (computers, tablets or smartphones) to connect to the internet. In the United States Nielsen (2013) discovered that 80% of Americans with telephones or tablets have used them at some time while watching television, and in only one year, 32 million users tweeted about some television programs. Wagner (2013) observed that 37% of television viewers use a social network at least once a week to comment on television programs on social networks as Facebook or Twitter.
Research on relations between social audience and television audience is still sparse, although it is shedding light on some very interesting aspects. For example, the Nielsen (2014) study finds that second screens help television programs create fans, and that this relationship is stronger in young people than in adults. Specifically, it was found that those using social networks while watching television claim to be more informed about other programs (25%), they have more fun watching television (15%), they record more programs (12%) and watch more live broadcasts (11%). Moreover, the study concluded that when comments increase by 8.5% amongst young people between the ages of18 and 34 the rating improves 1% in television in the premiere episodes; and for the same rating with adults (aged between 35 and 49) their comments should increase by 14% on Twitter. This relationship, more intense amongst young people than amongst adults, was also found by Bellman, Robinson, Wooley, and Varan (2014), who conclude that digital natives (under 30 years old) tend to alternate between television, tablets, smartphones and printed press 27 times an hour, while non-natives (between 35 and 55) alternate a maximum of 17 times an hour. Orban, Nagy, Kjarval, and Sanchez (2014) found that 85% of active Twitter users tweet about television during prime time, and amongst this group, one-third admitted to changing channels after seeing comments in the social network. These last data are extremely interesting for television channels that are becoming aware of the importance of the channel changing phenomena. In fact, Buschow, Schneider, and Ueberheide (2014) analyzed 30,000 tweets in Germany and concluded that evaluations of shows and actors were the main subjects of the explored tweets.
Therefore, the fact that television programs are commented on Twitter has forced television networks to take these social audience data into consideration in regards to their competitors. In a matter of a few years, television networks haven't only fought for share (audience, understood in the classic sense), but they have also begun to compete for Social Share, which has become an element that reflects audience engagement with a program, thus feeding future audiences (Tuitele, 2013). Other researchers Bruns and Stieglitz (2013) consider that it is too early to claim with certainty the relationship between the use of Twitter and the audience because much research into its uses remains centered around isolated cases.
There is no doubt that the Twitter phenomena on television is successful because a kind of a "virtual lounge room" has been created where commenting on live programs is attractive and in which viewers do not have to wait until work the next day to do so (Harrington, Highfield, & Bruns, 2013, p. 406); "during these programs, reading and making comments adds an extra layer of enjoyment to the viewing experience, equaling or potentially surpassing the warm experience of sharing a TV program with family or friends in the same room" ' (Bellman et al., 2014, p. 2). The new screens have taken up a place in our daily lives and have allowed us to create an experience of social viewing that lets users post comments live, see what others post or chat in real time, although the fusion of both technological systems has not happened yet (Courtois & D'heer, 2012). Nevertheless, it is sensible to consider that not all spectators who can potentially interact do so, surely because of the pleasure produced by passive behavior while viewing some television content (Gallardo & Jorge, 2010; Owen, 2000).
Television channels are aware of this new context and try to increase their audience with new strategies such as including hashtags during their broadcasts. Therefore "social media-enhanced live viewing serves to rebalance the broadcaster/audience relationship back in favour of the broadcaster" (Highfield, Harrington & Bruns, 2013, p. 318). For example, they conclude that user comments generate a strong incentive for the live viewing even of pre-recorded programming, and this fact renews the television power over scheduling ofaudiovisual content. Cameron & Geidnet (2014) believe that opinions ofthe virtual public in which some television programs broadcast during shows on the screen also influence viewers that are at home and do not have to look at other screens. Thus there are many reasons to want to discover how second screens can change television-watching habits, how fans and television producers adapt to this new space of potential participation and if the relationship of these connections can actually create new practices in the media, texts and genres. It is easy to understand that this subject arouses interest in businesspeople and social scientists (sociologists, psychologists, etc.) since it is a new source of problems to be solved by scientific research in the economic and behavioral fields.
In this research, we will use the expression "most tweeted programs" to include the most discussed television programs on Twitter according to the number of users. Provided that this research took place in Spain, it is necessary to refer to the previous studies conducted there. The most tweeted programs began to be measured in Spain by a company called Tuitele in May 2012. The company was bought in 2014 by the multinational audience measuring Company Kantar Media, which is also responsible for measuring the traditional television audience with 4,625 People Meters. In April 2014, Kantar Media purchased The Data Republic, pioneers in monitoring Social TV in Spain, and owners of Tuitele, the platform on which they developed Instar Social, the Kantar Twitter TV Ratings analysis tool (Kantar Media, 2014).
According to the Interactive Advertising Bureau (2015), 82% of Spanish internet users between the ages of 18 and 55 use social networks, and the most used are Facebook (96%), YouTube (66%) and, in third place, Twitter (56%). The same study reveals that Twitter is mainly used on mobile devices, in other words, on screens that are not alternate television sets (smartphones or tablets). Specifically, the number of Spanish users that access social media with a smartphone is 48% of the total of all online users (Online Business School, 2015).
There are notable differences between television audiences and Twitter users that comment on programs. For example, 61% of social viewers in Spain that comment on Twitter are men (Tuitele, 2013) and 81% of the users are aged between 15 and 29 (Sysomos, 2014). His age group differs with that of television viewers in Spain where the audience aged between 14 and 34 makes up only 26.7% (Asociacion para la Investigacion de Medios de Comunicacion [AIMC, Association for Research of Media], 2014).
Tuitele (2013) analyzed the genres that include the programs with the most social viewers in Twitter in Spain, as well as the times that the most comments are made. He study concluded that the most tweeted programs from high to low were sporting events (22.4%), reality and docu-reality shows (14.7%), tabloid talk shows (14%), feature films (9.3%), series (11%), talent shows (7.5%), sports shows (4.3%), entertainment news shows (2.8%), and that 32% of all comments on Twitter in Spain during prime time refer to television programs. According to Interactive Advertising Bureau (2015) social media prime time in Spain is early evening, at night and in the middle of the morning; specifically, the study highlights the use of tablets at night (28%), while the personal computers are used in the early evening (32%) and smartphones during all time slots (40%).
In a more recent study, González-Neira & Quintas-Froufe (2014) analyze specific prime time programs and they conclude that those programs did not occupy the same positions in Twitter. Moreover they reached the conclusion that the success of a program in social audience does not depend exclusively on its genre or format. Nevertheless, the same authors analyzed in other article the talent show La Voz in Spain and concluded that the program has the same results in Social Share and real share although "the results do not allow us to establish a causality relationship between both audiences, nor do they show any possible correlations. Future studies should continue with this line of investigation" (Quintas-Froufe & González-Neira, 2014, p. 88). In another specific analysis of a mockumentary titled "Operation Palace" (broadcast on February 23, 2014 in Spain) they concluded that there was a considerable coincidence in the first position in real and social audiences during prime time and that "the behavior of both audiences was very similar, as the peak viewing time was a six-minute period, which coincided with the end of the broadcast" (Quintas-Froufe, González-Neira, & Díaz-González, 2015, p. 43).
The previously mentioned example is enough to appreciate the existing interest between social network users and television viewers. In this study we elaborated on the analysis of the most tweeted television programs based on their genre and time slot, as well as the relationship they maintain with the real audience, recorded by the People Meters that measure viewing habits. Therefore two research objectives were established:
First objective: to find out what are the most tweeted television programs based on their genre and time slot.
Second objective: to know if the television programs with the most social viewers on Twitter are the most watched programs on television of the day and if they are in the first position in their time slot.
The research has been conducted in Spain and with data provided by certified companies that are refered to below. While this study was being carried out in November 2014 the use of internet in Spain was 60.7% and television 88.6% (EGM, 2014). Gallego (2013) defends that the future of measuring television viewing is onTwitter. In our period of analysis Twitter had 3.5 million accounts that were opened in Spain although only 1.4 million were used during the last 30 days (The Social Media Family, 2014). Furthermore, given that in Spain there are two major television corporations, Atresmedia and Mediaset, we consider it necessary, apart from analyzing all of the programs of all of the channels together, to group the programs in clusters based on the specific channel and corporation.
Method
Research design
Descriptive and associative empirical research was carried out (Ato, López-García & Benavente, 2013), in which we have explored the existing functional relationship between the Social Share (SS, considering the top five television programs according to the number of users that comment on them on Twitter) and Traditional Share (TS, position held by the television program according to their share compared to the rest of the programs on that day and time slot) variables, and the characteristics of this relationship based on television channels, television corporations and time slots.
Data collection and sample
The data of traditional television audiences as well as the most tweeted television programs in Spain (TS and SS respectively) have been obtained from two sources: the company Kantar Media that measures television viewing in Spain, and Tuitele that officially measures social audience on Twitter in Spain. However since December 1, 2014 the company has been called Kantar Twitter TV Ratings after being purchased by Kantar Media. In order to obtain the data from Kantar Media we have used the InfoSys (2014, i+) application and the Tuitele data were obtained directly from their website where they are published daily (the company has assured us that they monitor program comments from 30 minutes before the program until 30 minutes after). We must keep in mind that in Spain, unlike other television markets, the TV audience data are mainly offered with share figures and not ratings in order to make comparisons with the competition. In regards to Twitter, the position of the most tweeted programs was recorded according to the number of users and not according to the number of comments in order to be able to quantitatively compare data in regards to real television viewers.
We have considered recording data on consecutive days and during an ideal period of time as essential to correctly observe the possible functional relationship between both variables. We chose the 30 consecutive days of the month of November for two main reasons. First, the data was not contaminated on those dates due to the influence of the important vacation period in Spain that could modify the behavior of the audiences. Second, because the month of November is when the television channels in Spain have already aired their most important new programs before the arrival of Christmas.
Considering this, we must emphasize that what we observed is a census; thus, the top five tweeted television programs were observed (Tuitele only offered the information ofthe five most discussed programs each day), and conditioned by these data, the position of the most watched television programs (TSDB) in Daily Broadcasts and the position of each program in its Time Slot (TS). Therefore, the total sample data were made up of 150 observations, 30 for each one of the daily top 5 programs.
Observable variables
The observable variables are specific programs, the television genre, the position held in the television channels and the broadcast time slot for each channel and each television corporation they belong to. The two largest television corporations in Spain are: Atresmedia whose main channels are Antena 3 and La Sexta; and Mediaset whose main channels are Telecinco and Cuatro, amongst others.
In regards to genres, the classification proposed by Barroso (1996) was applied and adapted to the two large private television corporations in Spain that broadcast channels openly and free of charge (Atresmedia and Mediaset). Therefore, we can differentiate broadcasts by tabloid talk shows, TV news magazines, sports news talk shows, reality shows, talent shows, soccer matches, Formula 1 races, award ceremonies, television series and movies. In regards to time slots, we have used Kantar Media's classification for our analysis: Morning (7 a.m. to 2 p.m.), Afternoon (2 p.m. to 5 p.m.), Evening (5 p.m. to 8:30 p.m.), Night 1 (8:30 p.m. to 12 a.m.), and Night 2 (12 a.m. to 2:30 a.m.). We have ruled out Early Morning (2:30 a.m. to 7 a.m.) due to its small audience and because no relevant broadcast was found in this sample time slot. We must point out that concerning the position of programs in their channel and time slot we have information available through positions 15 and 16 respectively.
Data analysis
All of the variables studied in this research have been exclusively considered in a nominal or ordinal manner. Thus, only the frequencies and percentages have been the descriptive statistics taken into account. The associations between the variables ofposition on Twitter and in television (channel and time slot) were tested with Spearman's correlation and the Kappa coefficient. Both statistical controls are different. The first one estimates the linear relationship between two ordinal variables and the second one tests the degree of agreement between the same categories of two variables. For the first one we consider all of the available variable levels. For the second one, the first 5 levels, since those are the ones we have for Twitter. The charts resulting from the contingency tables allow us to know more clearly what has been found in the previous statistical tests. Evidently, more important than the statistical significance is the effect size. The correlation values of Spearman and the Kappa coefficient can be considered as effect sizes of the associations they test. Data analysis was performed with the IBM SPSS statistical package (2014, V.22.0), with 5% a priori Type I error.
Results
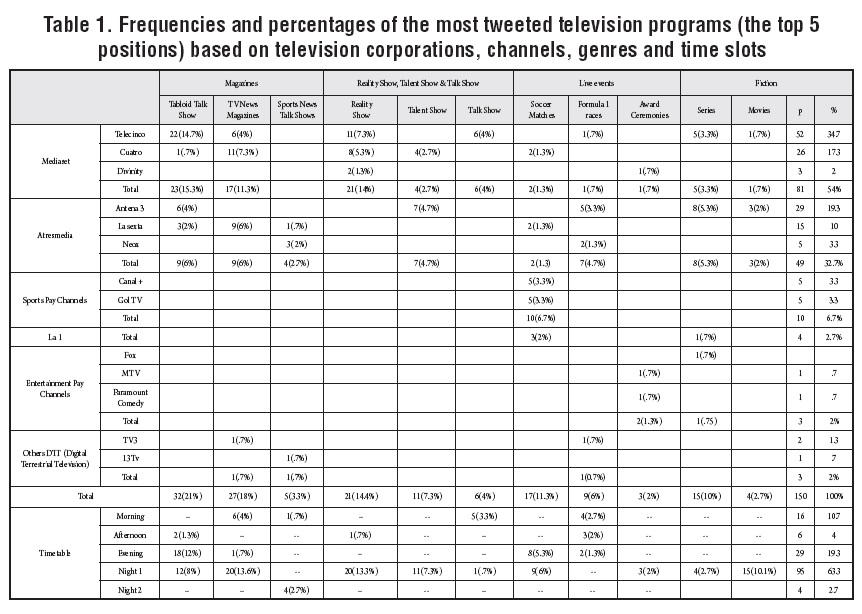
Table 1, 2 and 3 show the research results. Table 1 contains the results of the first of proposed objectives. In that table we can see the frequencies and percentages of the most tweeted television programs (the top five) depending on the television corporations, their TV channels, program genres and time slots.
In regards to genres, the most tweeted are tabloid talk shows and TV news magazines (21% and 18%, respectively) followed by reality shows (14.4%). In fourth place are soccer matches (11.3%). Furthermore, if we put all sports programs together (sports news talk shows, soccer matches and Formula 1 races), they would be in second position with 20.6%. Fictional television series appear 15 times in the sample reaching a percentage of 10%. The least discussed genres on Twitter are talk shows, movies and award ceremonies (4%, 2.7% and 2%) respectively.
The specific programs with the most comments from highest to lowest are: Sálvame (tabloid talk show), soccer matches, Gran Hermano (Big Brother in English; reality show), Formula 1 races and Las mañanas de Cuatro (TV news magazine) that are commented N=20, 17, 13, 9 and 7 times respectively and which also constitute respectively 13.3%, 11.3%, 8.7%, 6% and 4.7%.
In regards to the time slots of the most tweeted programs, 63.3% are broadcast in the Night 1 (8.30 p.m. to 12 a.m.) time slot. It should be emphasized that the Night 1 time slot is within access primetime and prime-time in Spain (where primetime begins later than the rest of the countries in Europe and America: at 10:30 p.m.). The programs tweeted in the Evening (19.3%) and Morning (10.7%) time slots are far behind the previously mentioned group. It is worth noting that the tabloid talk shows, soccer matches and Formula races are the preferred programs on Twitter. The tabloid talk shows are slightly more tweeted in the evening than at night. The soccer matches are also preferred both in the afternoon and in the evening and the Formula 1 races are tweeted both in the morning and in the evening.
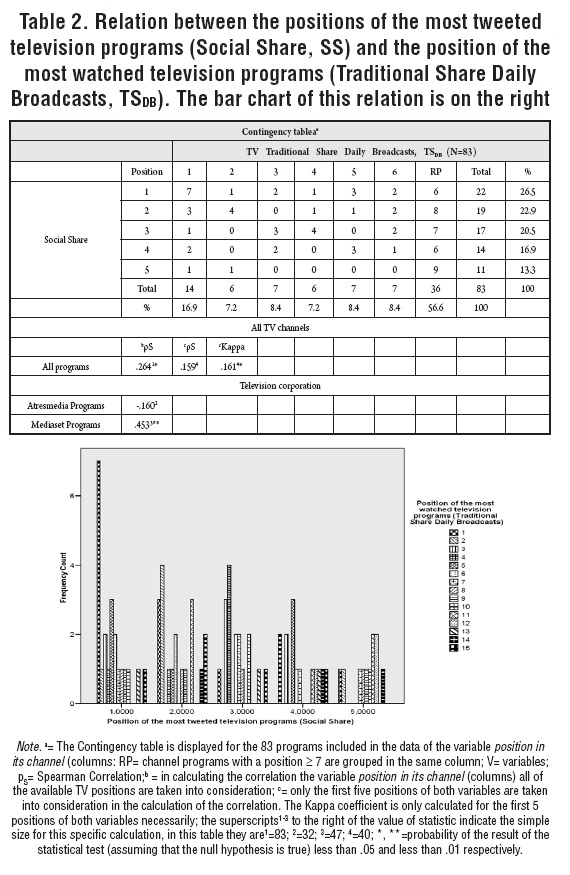
Table 2 and 3 are related to the second research objective and show the bivariate relationships between the variables that indicate positions of preference on Twitter and on television. The first noticeable point is the total quantity of programs observed in the two tables is different. This is due exclusively to the fact that the variables "position held by a program in daily broadcasts" and "position held by a program in its time slot" do not include the data of the programs that have been in the top 5 positions on Twitter. The reasons why the 150 data are not available are because the computer application we had access to did not record positions past the 16th position or because they were live sporting events broadcast on several pay channels at the same time (and, therefore, they were not quantifiable data due to the existence of several television channels). For these reasons there are 83 programs in Table 2 and 135 programs in Table 3. Moreover, we have included a column titled RP (Rest of Programs) in both tables, where all of the programs are included that are positioned higher than sixth place in the two Traditional Share variables. This was done to save space and because the representation of programs beyond this position is very small.
Regarding Table 2, and observing only the marginal percentages, we can observe, on one hand, that the percentage of tweeted television programs gradually decreases as we move away from the first position on Twitter. This being the case, on Twitter in 1st position 26.5% of the programs are tweeted while in 5th position the percentage drops to only 13.3%. On the other hand, we see that the percentage ofprograms that occupy the first position amongst the daily broadcasts (TSDB) practically doubles the percentages of the rest of positions; in addition, between the 2nd, 3rd, 4th, 5th, etc., positions are not major differences in percentages.
If we look closely at the frequencies observed in the intersection of a row and a column in a bivariate table we can see that only 7 of the 83 programs of the sample coincided in the first position as the most tweeted program and as the program with the best Traditional Share on television.
In this manner, the Spearman correlation size is not surprising, which was pS=.264 and pS=.159 respectively, taking into consideration all of the positions of Traditional Share and only the first five respectively. Nevertheless, despite being the first statistically significant-Spearman correlation (pS=.264), we cannot say it has substantial importance. The Kappa coefficient is very low, .16, thus indicating that the agreement between the first five positions in both variables is not better than ifit was obtained by chance. If we observe this relationship for the television corporations Atresmedia and Mediaset, curiously we find the sizes pS=-.160 y pS=.453 respectively. In other words, we did not find a relationship between both variables for the Atresmedia programs and we see a positive relationship for the Media-set programs, not very high, but with enough value to study it in more detail. The chart shown in Table 2 helps to better become familiar with the relationship between both variables and will be explained later comparatively in regards to the chart in Table 3.
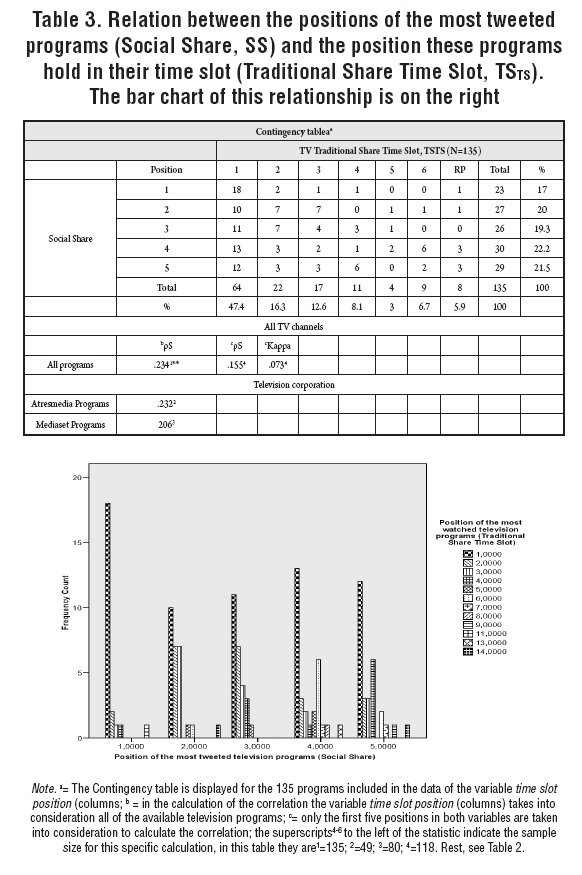
Table 3 outlines the relationship between the position that occupies a television program on Twitter based on the number of comments (SS) and the position that this same program occupies in television depending on the number of viewers (TS) but from a different point of view, considering the program position in its time slot (TS). Once more, beginning with marginal percentages, we see, on the one hand, that the percentage of tweeted television programs increases at first (compared to the first position), but it stays the same in the four remaining positions on Twitter. On the other hand, we see that the percentage of programs in first position in their time slots (47.4%) is 65.61% greater than the percentage of programs in second place in their time slot (16.3%), as can be seen by advancing positions in SS, with this percentage gradually decreasing. If we look at the frequencies in the intersection of a row and a column in a bivariate table we can observe a huge difference in the first column, in which there are two-digit figures, in regards to the rest of the columns in which they are always single digits and where the most frequent result is ≤1.
Accordingly, again, the Spearman correlation size is not surprising, which was pS=.234 (taking into account all the positions of the Traditional Share in accordance with the time slot, N=135) and pS=.155 (if the first five positions are only taken into account in the calculation of the correlation, N=180). While the first correlation (pS=.234) is statistically significant we cannot say in this case that it has substantial importance. Moreover, the Kappa coefficient is very low, .073, indicating, also in this case, that the agreement between the first five positions in both variables is not better than obtained by mere chance. If we observe this relationship for the television corporations of Atresmedia and Mediaset we find the sizes pS=.232 y pS=.236 respectively and therefore the same scenario as for all of the channels together.
In Table 3 the chart of the previously mentioned relationship is presented. This chart differs a lot from the one presented in Table 2. In Table 2 we can observe that there could be a linear correlation between the two variables, but it is clearly altered (by moderation, mediation or both, perhaps) by one of the programs of the two large television corporations (Gran Hermano, on Mediaset, probably) and perhaps by another variable. Nevertheless in Table 3 we can see that there is no linear correlation, but there is another type of relationship and it is very strong. We can clearly observe that in each of the Twitter positions (abscissa axis) the Traditional Share position experiences an exponential tendency.
Discussion and conclusions
The aim of this study is to explore the relationship between the most watched television programs and the comments that these programs generate on Twitter. We have materialized this intention with two objectives: first, to find out what are the most tweeted television programs according to their genre and time slot, and second, to examine if television programs with the most social viewers on Twitter are the most watched programs of the day. Both objectives have been empirically addressed by analyzing objective data provided by Kantar Media and Tuitele from the month of November 2014.
We have observed that the tabloid talk shows, the TV news magazines and the reality shows are the most tweeted programs and these three genres make up more than halfof the most tweeted contents with 21%, 18% and 12.4% respectively. Therefore we are of the same opinion as Bellman et al. (2014) and Harrington et al. (2013), that these are the most successful contents because they create a perfect common space to have virtual conversations due to interest of the subject matter that they develop. We were not surprised by the importance of contents related to sporting events with 20.6% and, mainly, soccer matches (11.3%). The conclusion we have reached is that sporting events, especially soccer matches, have a prominent position reserved on Twitter because it is the most important sport in Spain and generates huge audiences independent of its time slot (Evening and Night 1). In that matter, Formula 1 races (6%) are always broadcast in the morning (in the studied time frame) and are one of the most tweeted programs (N=9). In regards to sports news talks shows (3.3%), it is necessary to emphasize that they are a format of sports debate that started in Spain in 2008 in a small TV channel (Intereconomía TV), but with SS data well above the channel's average. The genre extended later to other small television channels (Neox, 13Tv, etc.) with a huge impact on social networks despite its low Traditional Share compared to larger television channels.
The success of sports programs on Twitter is so important that Kantar Media has decided to offer sports broadcast data independently of other television programs. When we started to analyze our data we found this to be necessary and therefore we believe that the decision is correct as sports programs can distort the social success of other television programs. In fact, the measurement company Kantar Media faces the problem of discriminating between the comments generated on Twitter by the viewers of television and the comments generated on Twitter by the people who are in the soccer stadium or the listeners of the sports programs of the radio, which have a large audience success in Spain (AIMC, 2014). For example, Piñeiro (2015) has detected a big impact in Twitter of the sport programs from the Spanish radio according to their number of followers and influence. In this context it is difficult to discriminate these types of tweets so as to assess the SS only from television.
We also have found that talk shows, movies and award ceremonies (4%, 2.7% and 2%) are the least tweeted genres. The low presence of movies (N=4) is noticeable amongst the most tweeted programs despite the fact that the large television channels (Antena 3, Telecinco, La 1, La Sexta and Cuatro) broadcast at least one movie during prime time each week with teasers like El peliculón de Antena 3 (The megahit of Antena 3); El taquillazo de... (The blockbuster of...), La película de la semana (The movie of the week), etc. This could be because specific content can generate a more passive attitude in the viewer when watching television (Gallardo & Jorge, 2010; Owen, 2000). In regards to the awards ceremonies, their percentage amongst the most tweeted television programs is low, but we must consider that the three award ceremonies were broadcast during the sample month (November 2014) reached one of the top-five positions amongst the most tweeted programs. We must also take into consideration that award ceremony broadcasts are not regular and they are not habitual in the programming offered by the television. The ceremony broadcasts take place very few times a year. Thus, the fact that there were three ceremonies in the studied period has been an extraordinary event (highlighted by the MTV Music Awards).
We cannot say that our results wholly converge with those published by Tuitele (2013). Generally speaking, there seems to be a coincidence in regards to live sports broadcasts, reality shows and tabloid talk shows (Tuitele, 2013), but that is not the case with TV news magazines, which are catalogued in their study as "current news programs". In fact, Tuitele only found 2.8% in Social Share for news magazines, very different from what we found, which was 18%. We think that may be due to the fact that throughout the month of analysis there were many scandals of corruption on Spain and these were the events more discussed in news magazines.
Our data reveal that 63.3% of the most tweeted broadcasts are during prime time (Night 1). This data is quite different than what was found by Tuitele (2013), which was 32%, thus we conclude that it is a fact that the more people that are watching television, the more probabilities there are that the program will be one of the most tweeted that day as defended by Gallego (2013). In this sense, Twitter adapts to Spanish television viewing in which prime time begins later than in other countries. Nevertheless, it should be highlighted that sports broadcasts prove that a specific program can be successful on Twitter independently of the time slot, as explained earlier.
Regarding the second objective, the possible agreement between the most tweeted program position (SS) and the position held on television (TSDB and TSTS) is not greater than that expected by chance by the Kappa Coefficient. This same relationship is interesting when examined by the Spearman correlation. However, we have found that the most interesting relationship thus far within the study is between the position held by one of the most tweeted programs (SS) and the position held on television in its time slot (TS). In such a way, the fact of being the most watched program of its time slot extraordinarily increases the probability of being one of the top five most tweeted programs. One explanation to this could be that the program most watched in its time slot reaches the biggest number of viewers and, therefore, more potential users of Twitter (mainly if it is broadcast in prime time). Nevertheless, we should also take into account other variables in future research endeavors. However, this effect does not happen when a program is in second place in its time slot and much less when the position is even further away. In conclusion, we have noticed that if a television program is ranked in irst place as the most watched that day or, mainly, in its time slot, it has more probabilities than others to be in the top-five commented programs on Twitter. However, to be more specific, only 18 programs were initially found in first position in TSTS and SS (Table 3); whereas only 7 programs in first position in TSDB and SS (Table 2). In fact, we observed that it is too difficult to find a real and accurate correlation between the success in traditional television and Twitter. This however, could be explained because "there is no parallelism between the profile of the television audience and the profile of the social audience" (Aguilar, Paniagua, & Farias, 2015, p. 550).
As a sample of the variety of uneven interpretations that could be made based on the perspective we chose, four different views were found as a result: first, the pS values that were displayed in Table 2 were all positive; nevertheless, the relationship could also be negative for some programs as happens with the "award ceremonies", which are broadcast on smaller channels with reduced audiences (Divinity, MTV and Paramount Comedy), but find their way into the top five most tweeted programs. Second, González-Neira & Quintas-Froufe (2014), studying only 5 days and one time slot, conclude that the relationship between both audiences does not exist because they found relations such as what we have just pointed out about the award ceremonies. Third, in other studies, Quintas-Froufe et al. (2015) detect a strong relationship between the success of the mockumentary "Operacion Palace", which held first place on Twitter, and the success of the television program, but this time their exceptional nature is noted. Fourth, as seen in our sample, it was discovered that one single television program can be a huge hit on Twitter along with real audiences. For example the Spanish reality show Gran Hermano (Telecinco, N=13) is a program that was in the first positions in real audiences in the Night 1 time slot and stood out the entire month as one of the most tweeted programs. In our opinion this program precisely provokes an elevated correlation in the Mediaset group. Therefore, we agree with Buschow, Schneider, and Ueberheide (2014) when they conclude that different TV programs (such as realities) evoke different communication activities, qualitatively and quantitatively. For example, tabloid talk shows, TV news magazines (depending on the current affairs), realities and all sport programs would promote more social interaction on Twitter. However, from our point of view, the relationship between these variables must not be examined in absolute terms, but rather in relative terms and more research must be done to know what variables are responsible for this behavior.
The data found in this study are interesting and shed some light on paths for new research. Moreover, we believe that the results found in Spain can be generalized to other countries since they are part of phenomena that extends to other television markets where the relationship between Twitter and television is growing. Particularly, when television programs are aimed to coexist with social networks because of the importance to be the first in traditional meters and in social media conversations.
References
Aguilar, M., Paniagua, F. M. & Farias, P. (2015). The behaviour of the television audienve on social networks. An approach to its profile and the most talked-about programmes. Revista Latina de Comunicación Social, 70, 539-551. doi: 10.4185/RLCS-2015-1058en
Asociacion para la Investigacion de Medios de Comunicacion, (AIMC, Association for Research of Media). (2014). Audiencia general de mediosEGM: Año móvil Febrero a Noviembre 2014. Retrieved September 10, 2015 from http://www.aimc.es/-Datos-EGM-Resumen-General-.html
Ato, M., López-García, J. J. & Benavente, A. (2013). A classification system for research designs in psychology. Anales de Psicología, 29, 1038-1059. doi:10.6018/analesps.29.3.178511
Barroso, J. (1996). Realización en los géneros televisivos. Madrid: Editorial Síntesis.
Bellman, S., Robinson, J. A., Wooley, B. & Varan, D. (2014). The effects of social TV on television advertising effectiveness. Journal of Marketing Communications, 58(3), 400-419. doi:10.1080/13527266.2014.921637
Bruns, A. & Stieglitz, S. (2013). Towards more systematic Twitter analysis: Metrics for tweeting activities. International Journal of Social Research Methodology, 16(2), 91-108. doi:10.1080/13645579.2012.756095
Buschow, C., Schneider, B. & Ueberheide, S. (2014). Tweeting television: Exploring communication activities on Twitter while watching TV Communications: The European Journal of Communication Research, 39(2), 129-149. doi: 10.1515/commun-2014-0009
Cameron, J. & Geidner, N. (2014). Something old, something new, something borrowed from something blue: Experiments on dual viewing TV and Twitter. Journal of Broadcasting & Electronic Media, 58 (3), 400-419. doi:10.1080/08838151.2014.935852
Courtois, C. & D'heer, E. (2012). Second screen applications and tablet users: Constellation, awareness, experience, and interest. EuroiTV '12 (proceedings of the 10th European conference on Interactive TV and video), 153-156. doi:10.1145/2325616.2325646
Gallardo, J. & Jorge, A. (2010). The low interaction of viewers in internet videos. Case study: Spanish YouTube. Revista Latina de Comunicacion Social, 65, 421-435. doi:10.4185/RLCS-65-2010-910-421-435-EN
Gallego, F. (2013). Social TV analytics: New metrics for a new way to watch TV. Index.comunicacion: Revista científica en el ámbito de la Comunicacion Aplicada, 3 (1), 13-39. Retrieved September 12, 2015 from http://dialnet.unirioja.es/servlet/articulo?codigo=4149293
González-Neira, A. & Quintas-Froufe, N. (2014). Traditional Audience versus Social Audience: a comparative analysis on prime-time television. Mediterranean Journal of Communication, 5 (1), 105-121. doi:10.14198/MEDCOM2014.5.1.02
Harrington, S., Highfield, T. & Bruns, A. (2013). More than a backchannel: Twitter and television. Participations. Journal of Audience & Reception Studies, 10 (1), 405-408. Retrieved September 01, 2015 from http://www.participations.org/Volume%2010/Issue%201/30%20Harrington%20et%20al%2010.1.pdf
Highfield, T., Harrington, S. & Bruns, A. (2013). Twitter as a technology for audiencing and fandom. Information, Communication & Society, 16 (3), 315-339. doi:10.1080/1369118X.2012.756053
IBM SPSS. (2014). SPSS Statistics Desktop (Version 22.0.) [Computer software]. Downloaded from http://www14.software.ibm.com/download/data/web/en_US/trialprograms/W110742E06714B29.html
InfoSys. (2014, InfoSys, (version [Computersoftware]. Retrieved from http://www.kantarmedia1.es/iles/docs/folleto_kantarmedia.pdf
Interactive Advertising Bureau. (2015). VIEstudio de Redes Sociales de IAB Spain, Enero de 2015. Retrieved August 10, 2015 from http://www.iabspain.net/wp-content/uploads/downloads/2015/01/Estudio_Anual_Reds_Sociales_2015.pdf
Kantar Media. (2014). Kantar Media lanza el primer sistema oficial de medicion de Twitter: Kantar Twitter TV Ratings. Retrieved July 24, 2015 from http://www.kantarmedia1.es/noticias/view/117
Nielsen. (2013). New Study confirms correlation between Twitter and TV ratings. Retrieved September 8 2015 from http://www.nielsen.com/us/en/insights/news/2013/new-study-conirms-correlation-between-twiter-and-tv-ratings.html
Nielsen. (2014). Living social: How second screens are helping TV make fans. Retrieved September 12, 2015 from: http://www.nielsensocial.com/living-social-how-second-screens-are-helping-tv-make-fans/
Online Business School. (2015). Análisis de las tendencias de uso y participacion en las redes sociales a nivel mundial en España. Retrieved October 15, 2015 from http://www.obs-edu.com/noticias/estudio-obs/espana-aumenta-el-numero-de-usuarios-activos-en-redes-sociales-en-2014-y-llega-los-17-millones/
Orban, P., Nagy, J., Kjarval, N. & Sanchez, X. (2014). Discovering the value of earned audiences - how Twitter expressions activate consumers. Retrieved August 10, 2015 from http://thearf-org-aux-assets.s3.amazonaws.com/events/rethink/social-media-one-pager.pdf
Owen, B. M. (2000). The internet challenge to television. Massachusetts: Harvard.
Piñeiro, T. (2015). From the waves to 140 characters. The use of Twitter by leading spanish radio programs. Palabra Clave, 18(3), 815-841. doi: 10.5294/pacla.2015.18.3.8
Quintas-Froufe, N. & González-Neira, A. (2014). Active audiences: Social audience participation in television. Comunicar: Media Education Research Journal, 43, 83-90. doi:http://dx.doi.org/10.3916/C43-2014-08
Quintas-Froufe, N., González-Neira, A. & Díaz-González, M. J. (2015). The communication strategy developed on Twitter to promote a mockumentary: Operacion Palace. Revista Latina de Comunicacion Social, 70, 28-48. doi:10.4185/RLCS-2015-1033en
Sysomos. (2014). Inside Twitter: An in-depth look inside the Twitter world. Published June 2009. Retrieved October 02, 2015 from https://www.sysomos.com/docs/Inside-Twitter-BySysomos.pdf
The Social Media Family. (2014). I Estudio sobre los usuarios de Facebook y Twitter en España. Retrieved 23 November, 2015 from http://mediaesfera.com/estudio-sobre-los-usuarios-de-facebook-y-twitter-en-espana/
Tuitele. (2013). Un año de television social en España, Septiembre 2012 - Agosto 2013. Retrieved October 12, 2015 from: http://informes.tuitele.tv/emailing/Tuitele_1_a%C3%B1o_tv_social_en_Espa%C3%B1a.pdf
Wagner, J. (2013, June 13). Social media's impact on TV isn't that big, new study finds. VentureBeat. Retrieved October 10, 2015 from http://venturebeat.com/2013/06/13/social-medias-impact-on-tv-isnt-that-big-new-study-finds/